


See and Plan the Bigger Picture: Visual Planning for Oil & Gas and Utilities
In the world of Oil & Gas and Utilities, time is never just time — it’s production, safety, and reliability measured in every second. A maintenance delay can ripple through entire operations; a scheduling conflict can ground an entire team. For years, planners and engineers have relied on spreadsheets, whiteboards, and endless coordination calls to keep complex operations on track.
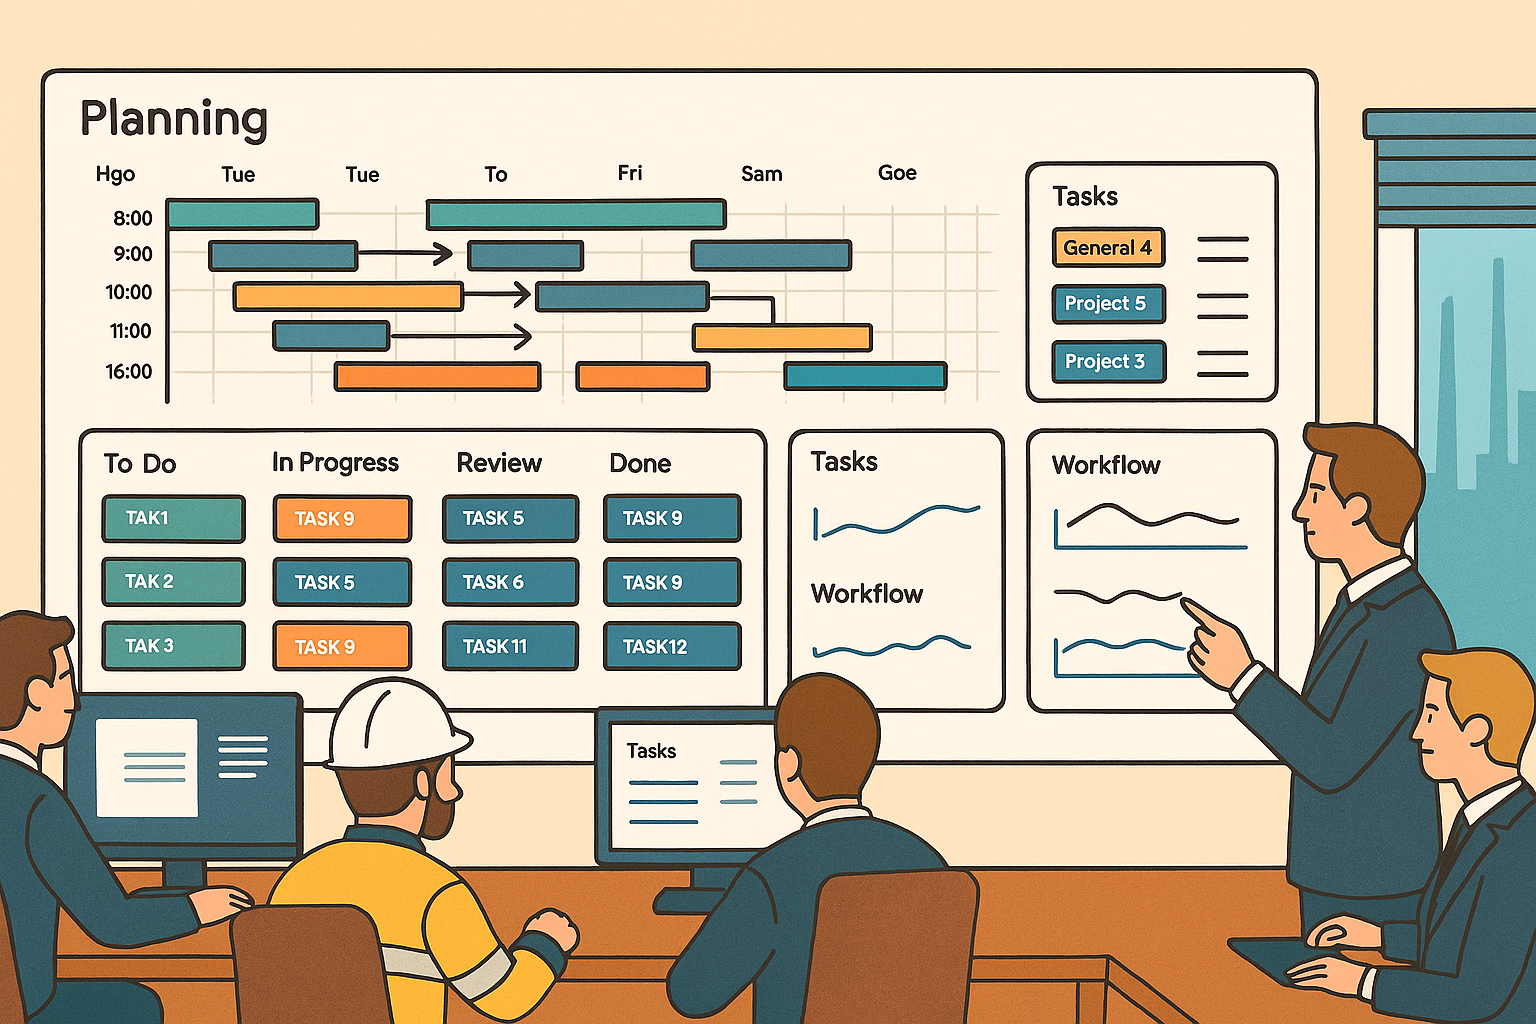
But the way we plan, coordinate, and respond has evolved — from spreadsheets to something far smarter. Imagine walking into a control room during a major refinery shutdown. Screens glow with thousands of tasks — inspections, repairs, testing — each color-coded, each linked to people, equipment, and timelines. There’s no guesswork, no confusion, no waiting on updates.
Every moving part is visible. Every decision is informed. That’s the power of visual planning — turning static data into an interactive experience that connects people, assets, and schedules into one living, dynamic plan.
Bringing Operations to Life
At its core, visual planning combines intuitive visualization with real-time collaboration. It’s more than software — it’s a new way of thinking.
Planners can drag and drop maintenance tasks across charts or calendars, instantly seeing how one change affects the rest of the schedule. Field crews get live updates on mobile devices, while managers view workload balances, equipment availability, and dependencies in one unified dashboard.
The system doesn’t just display data — it interprets it. Conflicts are flagged automatically, workloads are optimized, and critical tasks rise to the top before they become bottlenecks. Everything is connected — from high-level strategy to field-level execution.
For a refinery planning its annual turnaround, visual planning becomes the nerve center — mapping thousands of work orders, assigning teams, and ensuring each job happens in the right sequence. And for pipeline maintenance teams spread across remote regions, it offers something invaluable: visibility. Knowing exactly who is where, what’s been done, and what’s next — all in a single, shared view.
The Results Speak for Themselves
The impact of visual planning isn’t measured only in charts and metrics — it’s felt in the flow of daily work.
Maintenance planners finish schedules days faster. Supervisors make quicker, safer decisions. Field technicians arrive on site with clarity instead of confusion.
Downtime drops. Safety compliance strengthens. Communication barriers disappear.
And most importantly, people across departments — operations, maintenance, safety, and engineering — start working as one synchronized team.
As industries move toward digital twins and predictive maintenance, visual planning is becoming the bridge between data and action. It connects systems, people, and processes in a way that’s both visual and intelligent — a foundation for the next generation of digital operations.
See our visual planning and scheduling solutions to know more.